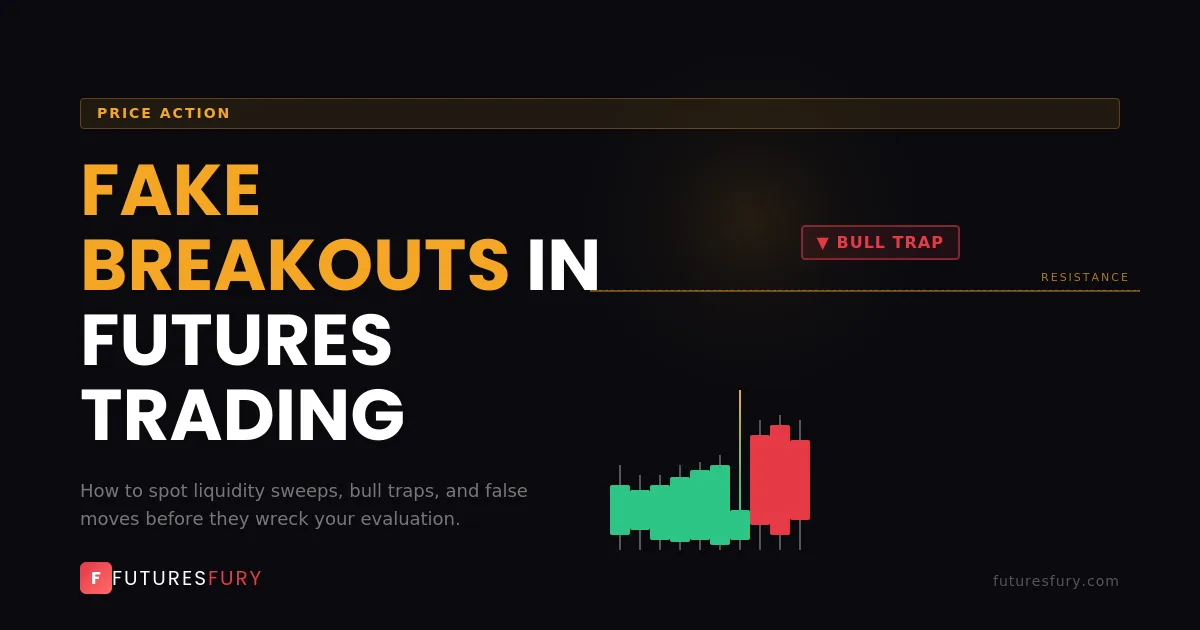
Fake Breakouts in Futures Trading: How to Spot and Avoid Them
You've watched price consolidate below resistance for 20 minutes. Volume picks up. A strong green candle breaks above the level. You enter long. And within 60 seconds, price reverses violently, stops you out, and continues falling.
If this scenario feels painfully familiar, you've been caught in a fake breakout — also known as a liquidity sweep. It's the most common trap in futures markets, and it's responsible for more blown evaluations than any other single pattern.
The good news? Fake breakouts aren't random. They're engineered, and once you understand the mechanics, you can learn to spot them before they trigger.
What Are Liquidity Sweeps?
To understand fake breakouts, you need to understand liquidity. In futures markets, large institutional traders can't simply click "buy" and get filled at one price. Their orders are so large that they need a pool of counter-party liquidity to execute against.
Where does that liquidity sit? At obvious levels — above resistance highs and below support lows. That's where retail traders place their stop losses. A buy stop above resistance becomes a market buy order when triggered, providing sell-side liquidity for an institution wanting to go short.
The sequence looks like this:
- Price approaches a visible resistance level where buy stops are clustered
- Institutional algorithms push price just above the level to trigger those stops
- The triggered buy stops create a burst of buying liquidity
- The institution sells into that liquidity, filling their short position at premium prices
- With the liquidity absorbed, price reverses sharply downward
The retail trader who bought the breakout is now trapped long in a falling market. The institution got exactly what they wanted: a filled position at the best possible price.
Key insight: The breakout itself is real — price genuinely moves above resistance. The trap is that the move is not sustainable. It exists only to harvest liquidity, not to continue in the breakout direction. Learning to distinguish between genuine breakouts and liquidity sweeps is critical for passing your prop firm evaluation.
How to Identify Trap Patterns
Fake breakouts leave fingerprints. Here are the telltale signs that a breakout is actually a trap:
- Quick rejection: The breakout candle closes back below the broken level within 1-3 candles. Genuine breakouts tend to hold above the level.
- Volume spike then drop: You see a volume surge on the breakout candle followed by declining volume. Real breakouts sustain their volume.
- Long upper wicks: The breakout candle has a long wick above the level — price probed higher but couldn't hold. This is a classic liquidity sweep signature.
- Time of day: Fake breakouts are most common during the first 15 minutes of a session (opening sweep) and around the London close. These are known institutional activity windows.
- Counter-trend: If the overall trend is down and you see a breakout above a minor resistance level, it's much more likely to be a trap than a reversal.
VWAP Rejection: The Institutional Tell
VWAP (Volume Weighted Average Price) is the benchmark that institutional traders use to evaluate their execution quality. It represents the average price at which volume has traded throughout the session — essentially the "fair value" of the market.
When price breaks out above resistance but remains below VWAP, you have a major red flag. The breakout occurred in "sell territory" — the zone where institutions are statistically more likely to be selling than buying. A breakout that can't reclaim VWAP is a breakout without institutional backing, and it's far more likely to fail.
The VWAP filter rule: Never take a long breakout if price is below VWAP. Never take a short breakdown if price is above VWAP. This single rule will filter out a significant percentage of fake breakouts from your trading. Combine this with knowledge of prop firm rules to protect your evaluation.
The reverse is also true. A breakout above resistance that occurs while price is already above VWAP has institutional wind at its back. These breakouts are far more likely to sustain because the buying pressure is aligned with the institutional flow.
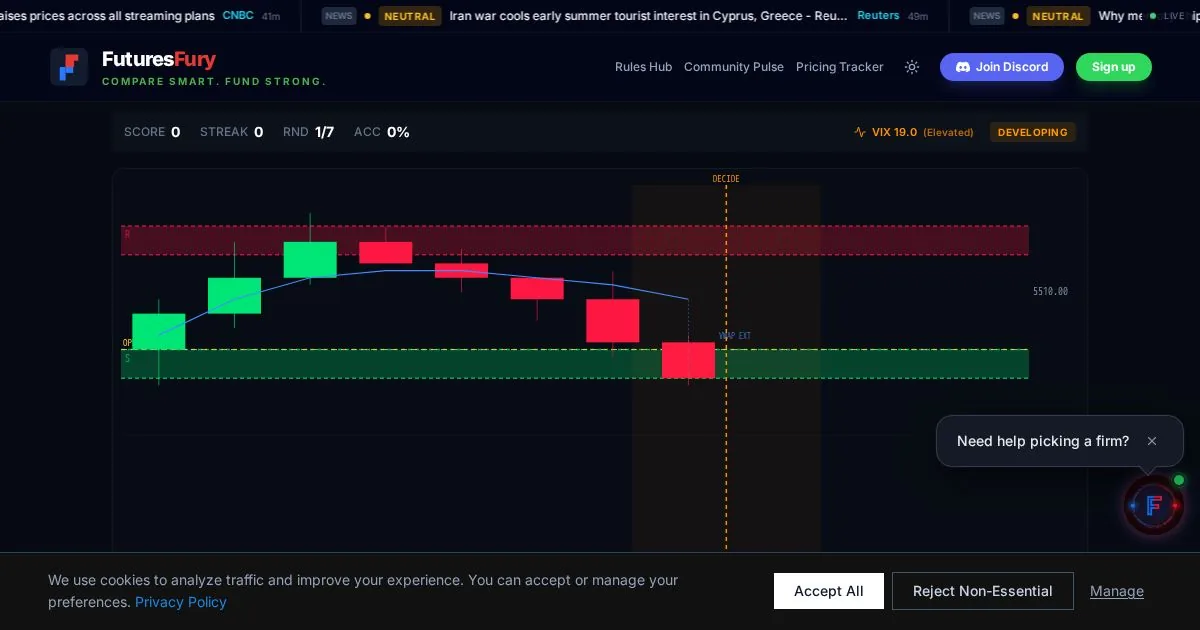
Do Not Trade Simulator
Can you tell a real setup from a trap? Practice identifying liquidity sweeps, fake breakouts, and valid entries in a risk-free environment. Your discipline score reveals your true trading edge.
Strategies to Avoid Getting Trapped
Knowing the theory is step one. Applying it under the pressure of live markets is step two. Here are actionable strategies for avoiding fake breakouts in your trading:
- Wait for the retest: Instead of entering on the initial breakout, wait for price to break the level, pull back, and then retest the level as new support. If it holds on the retest, you have a much higher-probability entry. If it fails the retest, you just dodged a trap.
- Use a candle-close filter: Don't enter until a full candle (5-minute or 15-minute depending on your timeframe) closes above the breakout level. Wicks don't count — only closes.
- Check the order flow: If you have access to a DOM (Depth of Market) or footprint chart, look for aggressive buying/selling at the breakout level. Passive orders (limit orders absorbing the move) at the level suggest a trap.
- Scale the timeframe up: A breakout on the 5-minute chart that doesn't exist on the 1-hour chart is often just noise. Always confirm breakouts on a higher timeframe.
- Practice pattern recognition: Use tools like the Do Not Trade Simulator to train your eye on distinguishing real setups from traps in a risk-free environment.
Real-World Example: The Opening Sweep
One of the most reliable fake breakout patterns in ES and NQ futures is the opening range sweep — see which firms rank highest for scalping-friendly rules. In the first 5-15 minutes of the regular session (9:30 AM ET), price will often sweep above or below the pre-market range to trigger stops before reversing sharply.
This pattern is so consistent that many professional traders build their entire strategy around fading the opening sweep — waiting for the initial directional move, confirming the sweep of a key level, and entering in the opposite direction with a tight stop above the sweep high (or below the sweep low).
If you're running an evaluation, firms like Bulenox let you choose your drawdown type — EOD over trailing gives more breathing room to survive early traps. Avoid entering in the first 15 minutes, wait for the sweep, and let the institutional move reveal itself.
Fake breakouts are not market anomalies — they're a fundamental feature of how modern futures markets operate. Institutions need liquidity to execute, and retail stop losses are the easiest source. Once you internalize this framework, you'll start seeing these traps before they trigger — and understanding your firm's drawdown type determines how much room you have to absorb these swings. If you're still building this skill, our beginner's guide highlights the most forgiving firms for newer traders.
Understanding each firm's trading rules is just as important as reading price action. Study drawdown types, consistency requirements, and payout policies on our Rules Hub before committing to an evaluation — then check for active discount codes to save when you're ready.
Frequently Asked Questions
What is a fake breakout in futures trading?
How do you identify a fake breakout?
Why do fake breakouts happen?
How do fake breakouts affect prop firm evaluations?
How can I avoid fake breakout traps?
Keep Reading
Guides and reviews related to this article
Bulenox Review
flexible drawdown options help survive early traps
Alpha Futures Review
no consistency rule, good for learning
Best Prop Firm for Scalping
which firms suit fast execution styles
What Is Trailing Drawdown?
know how much room you have to absorb sweeps
Trading Discipline Exercises
build your trap-identification muscle
Why Most Traders Fail Evaluations
the behavioral patterns behind blown accounts
Firms Mentioned
Comments (0)
No comments yet. Be the first to share your thoughts!